
I ran a study on how AI recommends brands. It does not see your brand the way you think.
For the last year I kept hearing the same promise. Get a score for how visible your brand is in AI. One number. Watch it go up and you are safe.
Watch this breakdown to see how city and language change the brands that AI recommends -
I wanted to know what that number actually represented. Buyers ask from different markets and in different languages. If those details change which brands AI recommends, how much can a single overall score tell us?
So how can one number be the truth for both of us?
I decided to stop guessing and test it. This is what I found.
What can a single AI visibility score miss?
If your AI visibility tracking relies on English prompts without explicit market context, it may miss important differences in what buyers are shown.
Your buyer could be in Mumbai, Madrid or Berlin. They might ask in Hindi, Spanish or a mix of languages. A score built around one set of conditions cannot tell you how your brand performs across all those situations.
For this study, we used New York and English as the comparison baseline. We wanted to see how far the recommendations moved when the buying context changed.
How did we run the study?
We tested ten software categories, with no FTA clients included in the study. For each category, we kept the buying intent and buyer persona consistent, then varied the city and language.
Every question was run on ChatGPT and Gemini, five times per tested condition. That let us examine differences across contexts and variation between repeated answers.
.jpg)
1. The answer changes by city
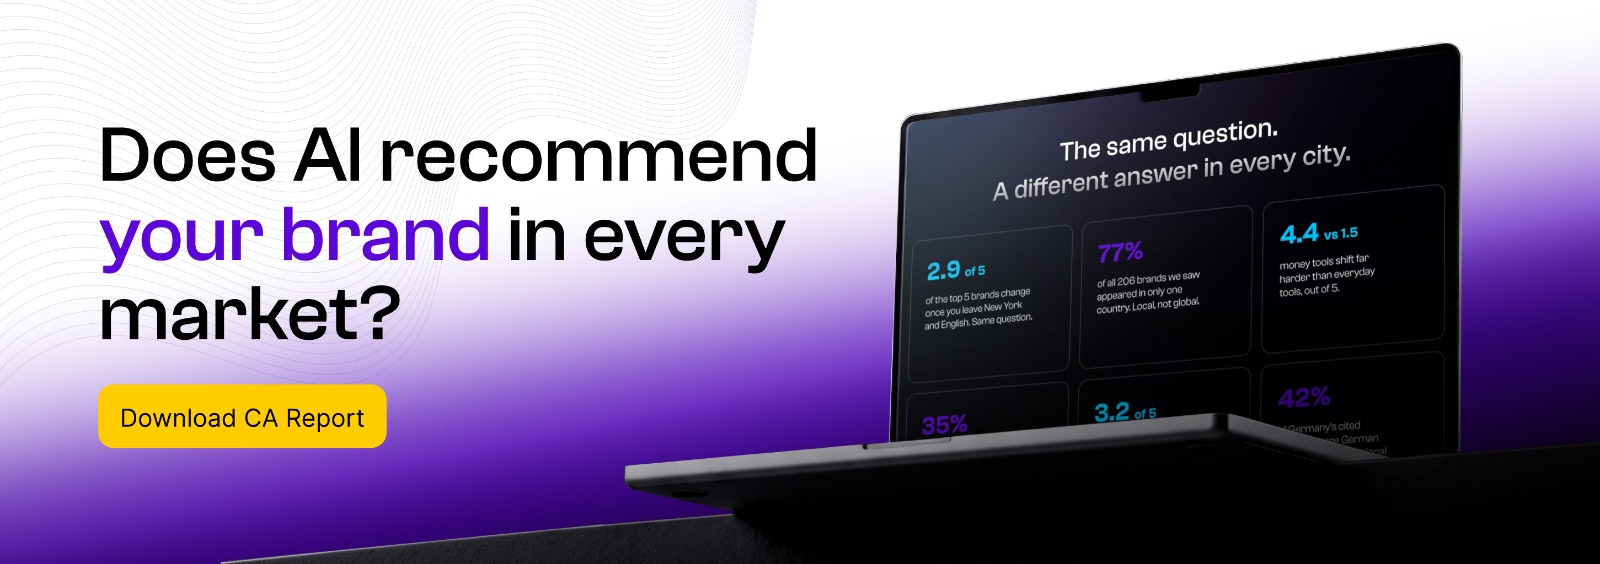
Compared with the New York English baseline, an average of 2.9 of the top five brands changed across the other tested contexts. The buying intent stayed consistent. The shortlist often did not.
.jpg)
2. The more the money matters, the more it changes
The size of the change depended on the software category. Payroll, accounting, payments and HR changed by an average of 4.4 of the top five brands against the New York baseline. For project management, video conferencing and cloud storage, the average was 1.5.
.jpg)
HR showed the largest shift. None of the brands in the New York HR top five appeared in the top five for the other tested cities.
The heatmap below shows the differences across categories and cities. Darker squares mean more brands changed from the New York shortlist.
.jpg)
3. Most brands appeared in only one country
We recorded 206 distinct brands across the study. Of those, 159, approximately 77%, appeared in the top five in only one of the eight countries tested. Just 14 appeared in all eight.
That does not mean those 159 brands only operate locally. It means their recommendation visibility in this study was concentrated in a single country.
.jpg)
The scatterplot shows a selection of notable brands, comparing their reach across countries with their visibility in their strongest market. Among the brands shown, some combine broad reach with strong visibility. Others perform strongly in a much smaller number of markets.
For marketers, this distinction matters. A strong position in one market does not establish that buyers elsewhere will see the same brand.
.jpg)
Stripe makes the difference tangible. In the report’s payments leaderboards, it ranked first in New York, London, Madrid, Paris and Berlin. It did not appear in the top five for Mumbai, Delhi or Bengaluru. The same global brand had very different visibility across the tested markets.
.jpg)
4. Language can change the shortlist within a city
For the Mumbai payments question, we compared English, Hindi and Hinglish. All three versions returned a shortlist focused on Indian providers.
There were differences within that local shortlist. In Hindi, Paytm appeared in place of PhonePe. In Hinglish, PhonePe and PayU changed order compared with the English result.
In this example, language changed the selection or order without replacing the local shortlist with the New York one. English alone did not capture every version of the answer.
.jpg)
5. Even the two engines do not agree
Across matched questions and contexts, ChatGPT and Gemini shared an average of 3.2 of their top five brands.
For CRM in Paris, Gemini placed Sellsy first, while ChatGPT placed Pipedrive first. The buying context was the same, but the leading recommendation differed.
Your position on one engine cannot stand in for your position on another.
6. The same question wobbles
We ran each question five times under the same tested conditions. In only 35% of those conditions did all five runs name the same brand first. In the remaining 65%, the top recommendation changed at least once.
That does not mean every answer was completely different. It means even the first position was not consistently stable.
A single run records what happened once. Repeated runs help show whether a brand appears consistently or whether its position varies. That distinction matters when you are using the result to make a marketing decision.
.jpg)
7. The cited sources differ by market too
We also examined the sources cited in the answers. Local domains and publications accounted for 42% of cited sources in the Germany results, 34% in France and 17% in India.
Global review sites such as G2 and Capterra still appeared. But the citations also included local publications, review sites and company pages.
For marketers, this gives us a more specific research task: examine which sources appear in answers for each priority market. Those citations show part of the evidence presented to buyers. They do not reveal every source the model used or prove that securing coverage on a particular site will earn a recommendation.
.jpg)
What I did not test, on purpose
We kept the buyer persona fixed as a small business owner. That reduced one source of variation while we examined geography, language and differences between engines.
It also sets a boundary around the findings. This study does not establish what an enterprise procurement leader, a hospital buyer or a government team would receive.
How recommendations change across buyer roles and industries is the question for our next edition.
What this means for your brand
Your brand can rank highly in one tested context and be absent in another. An overall average can hide that difference.
Start with the markets your business serves, the languages your buyers use and the engines you want to understand. Then examine how consistently your brand appears within those conditions.
A useful visibility score should help you find those differences and decide where to act.
Why does context belong in the score?
This is the thinking behind Context Authority: measuring how well your brand shows up in a defined buying context.
The value of a score depends on what sits behind it. Which markets does it cover? Which languages and engines? How often were the questions repeated? Can you see where your brand performs well and where it disappears?
A summary number becomes useful when you can examine the differences underneath it. Those differences tell you where to act.
How did we conduct the study?
We tested ten software categories on ChatGPT and Gemini, with five runs per tested condition. The buying intent and small business owner persona stayed consistent while city and language varied.
No FTA Global enterprise client was included in the study. Questions were developed from neutral sources rather than brand websites. The full question set and underlying brand and citation data are available on request.
These findings describe the answers captured during our tests. Future runs may produce different recommendations, which is one reason repeated measurement matters.
When a buyer asks AI for a recommendation, a shortlist can form before they visit your website.
The question for your brand is specific: do you appear when buyers ask in the markets and languages that matter to your business? And do you appear consistently?
This is the visibility I want to understand.

Do you want more traffic?


Why AI Search Visibility Depends on Context & Not Just Prompts?
.avif)
Are You Measuring Demand or Just Measuring Traffic?